
Using Google Spreadsheets, how can you tell the strength and sign of an association?
ANSWER: The fastest way is to find the “r” using the spreadsheet formula “=correl(____, _____)” .
r < 0 : If you have a negative result then you have a negative correlation. (Means y goes down as x goes up.)
r > 0 : If you have a positive result then you have a positive correlation. (Means y goes up as x goes up.)
The closer the value of r is to 1 or -1, the stronger the relationship. For example, .9 or -.9 have strong relationships. .2 or -.2 would have weak relationships.
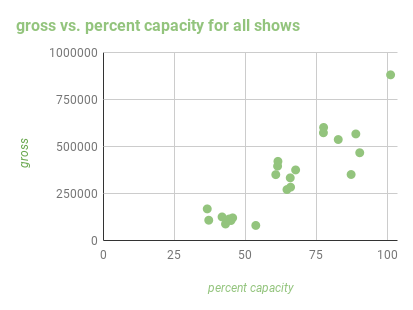
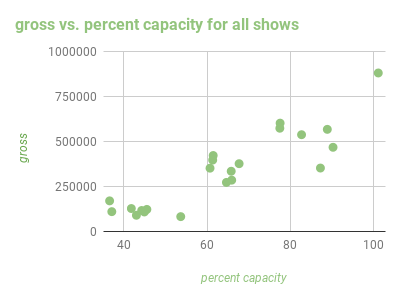
Be careful with looking just at charts. The following are different charts with the same data.
In the mini-lectures I provided places to practice guessing the r just by looking at graphs. Currently my favorite one is: http://guessthecorrelation.com/