The averages are not showing up in my chart for Module 7! Help!
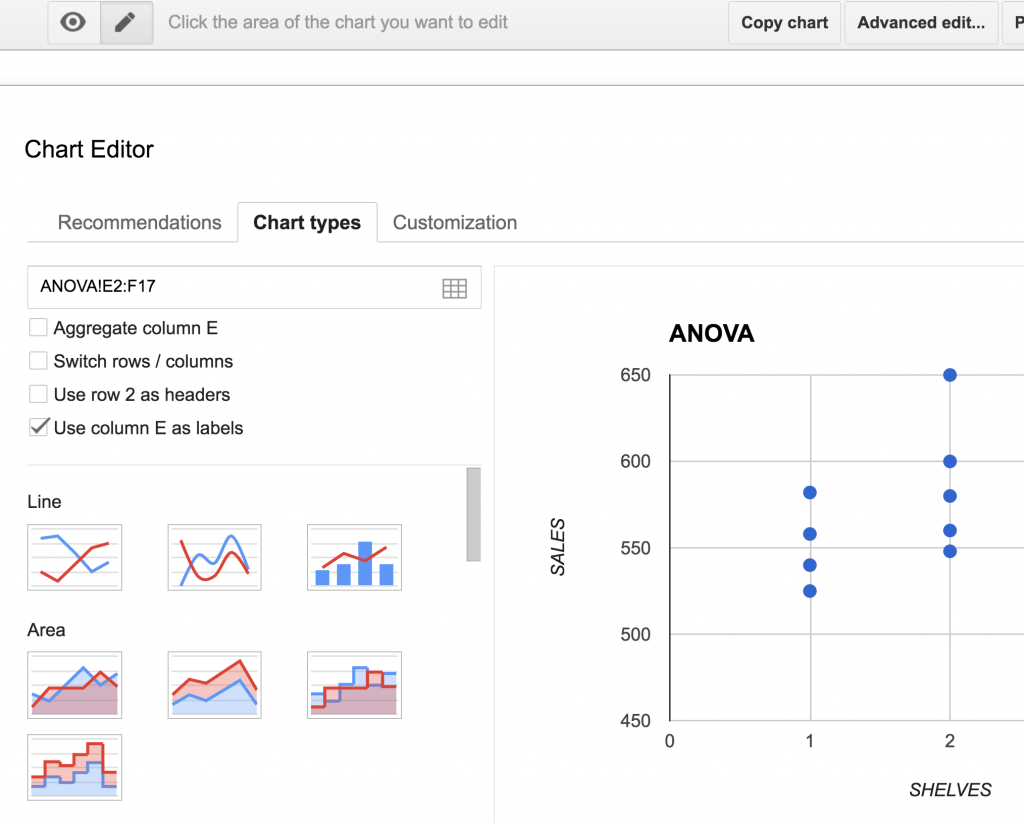
ANSWER: If you already made your chart and only one dot color is showing up then no worries. Click ADVANCED EDIT. I am going to show you with a student’s chart without a name to help.
Once you clicked on the chart and picked Advanced Edit… (top right corner). The chart editor appears with the 3 tab choices: Recommendations, Chart types, and Customization.
You want Chart types.
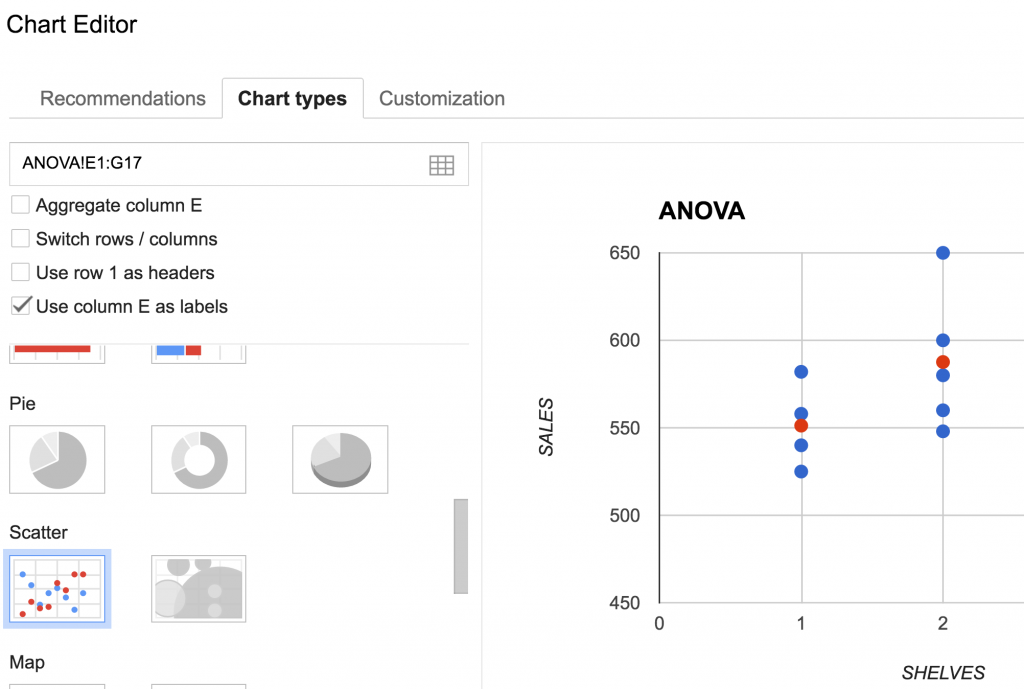
When you click you will notice that only one color dots are showing and that is because only 2 columns were selected (E and F). The averages were in column G. You can just manually type this in to the box! Then click on a different chart type and then back to a Scatter!
- Change what is on top. I rewrote to A1:G17 (because that is where the data was for this student)
- Click away from the current chart type.
- Click back to select Scatter
–> Should be working now! This has only started happening in the Fall 2016 semester. I am unsure why but the above should help.


