
Can I have some help with the regression line for the module 6 spreadsheet?
ANSWER:
Of course! Did you look over the tutorial? If not, look back over at the bottom. If yes, then let’s read the following.
For the least squares line we are replacing the “b” and “a” with values for this particular problem.
From the tutorial we have the equation, y = bx + a (where b is the slope and a is the intercept).
You can double-check to make sure you have the correct line with the chart. While you are creating the chart, you can do the following in the Customization tab.
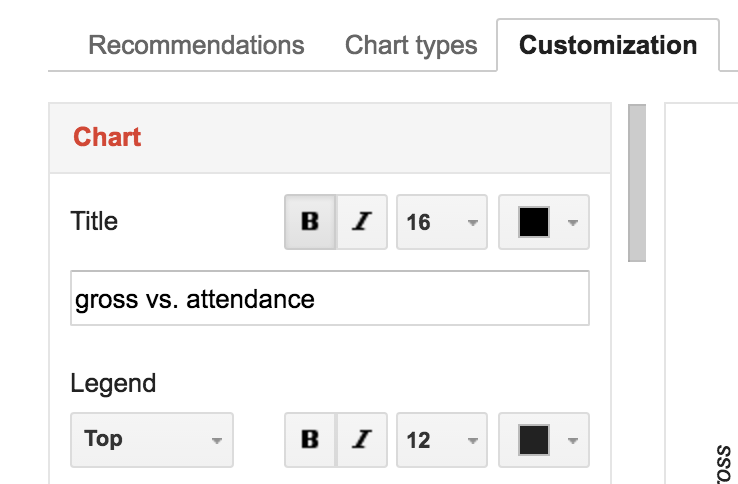
- Make sure the LEGEND shows up somewhere. Above I selected TOP but you can have it anywhere. As long as you have it selected.
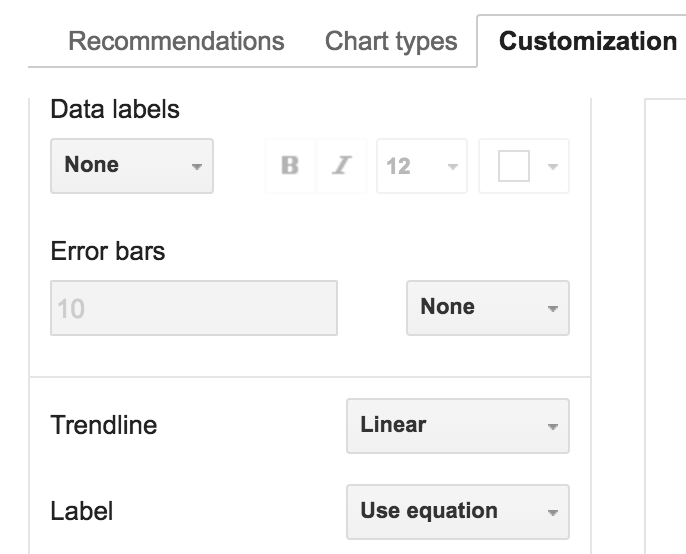
- Scroll down in the Customization area to where you see Trendline (see image above). Select Linear, as shown above. Finally…
- Click on Label and Select Use Equation (see image above).
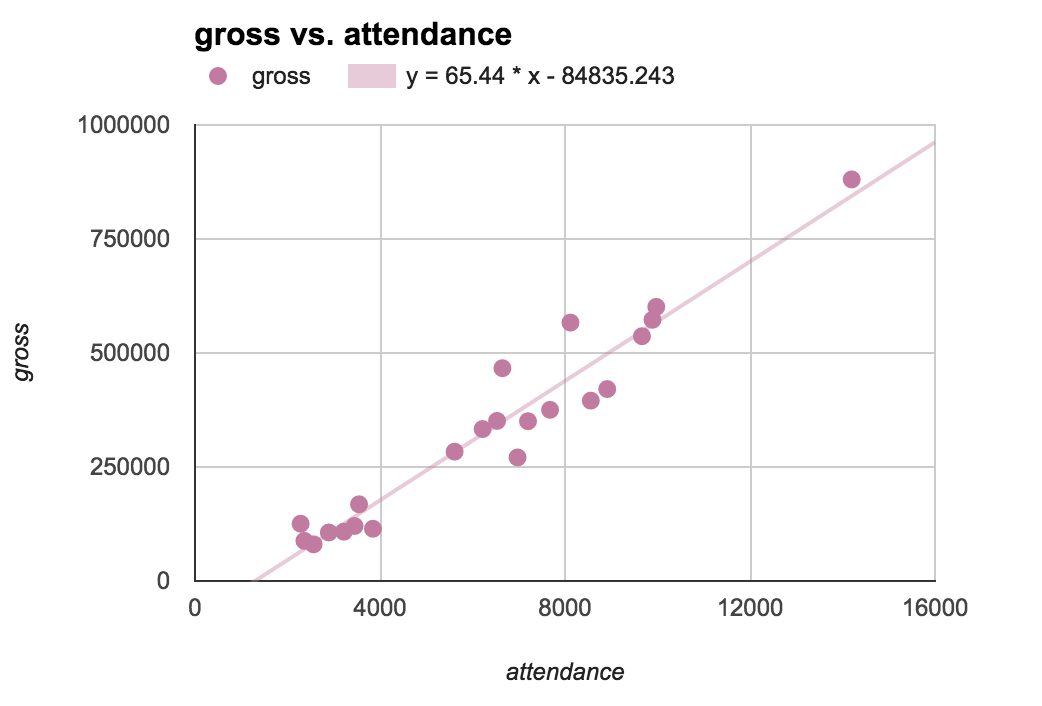
You will now see it show up on your chart!
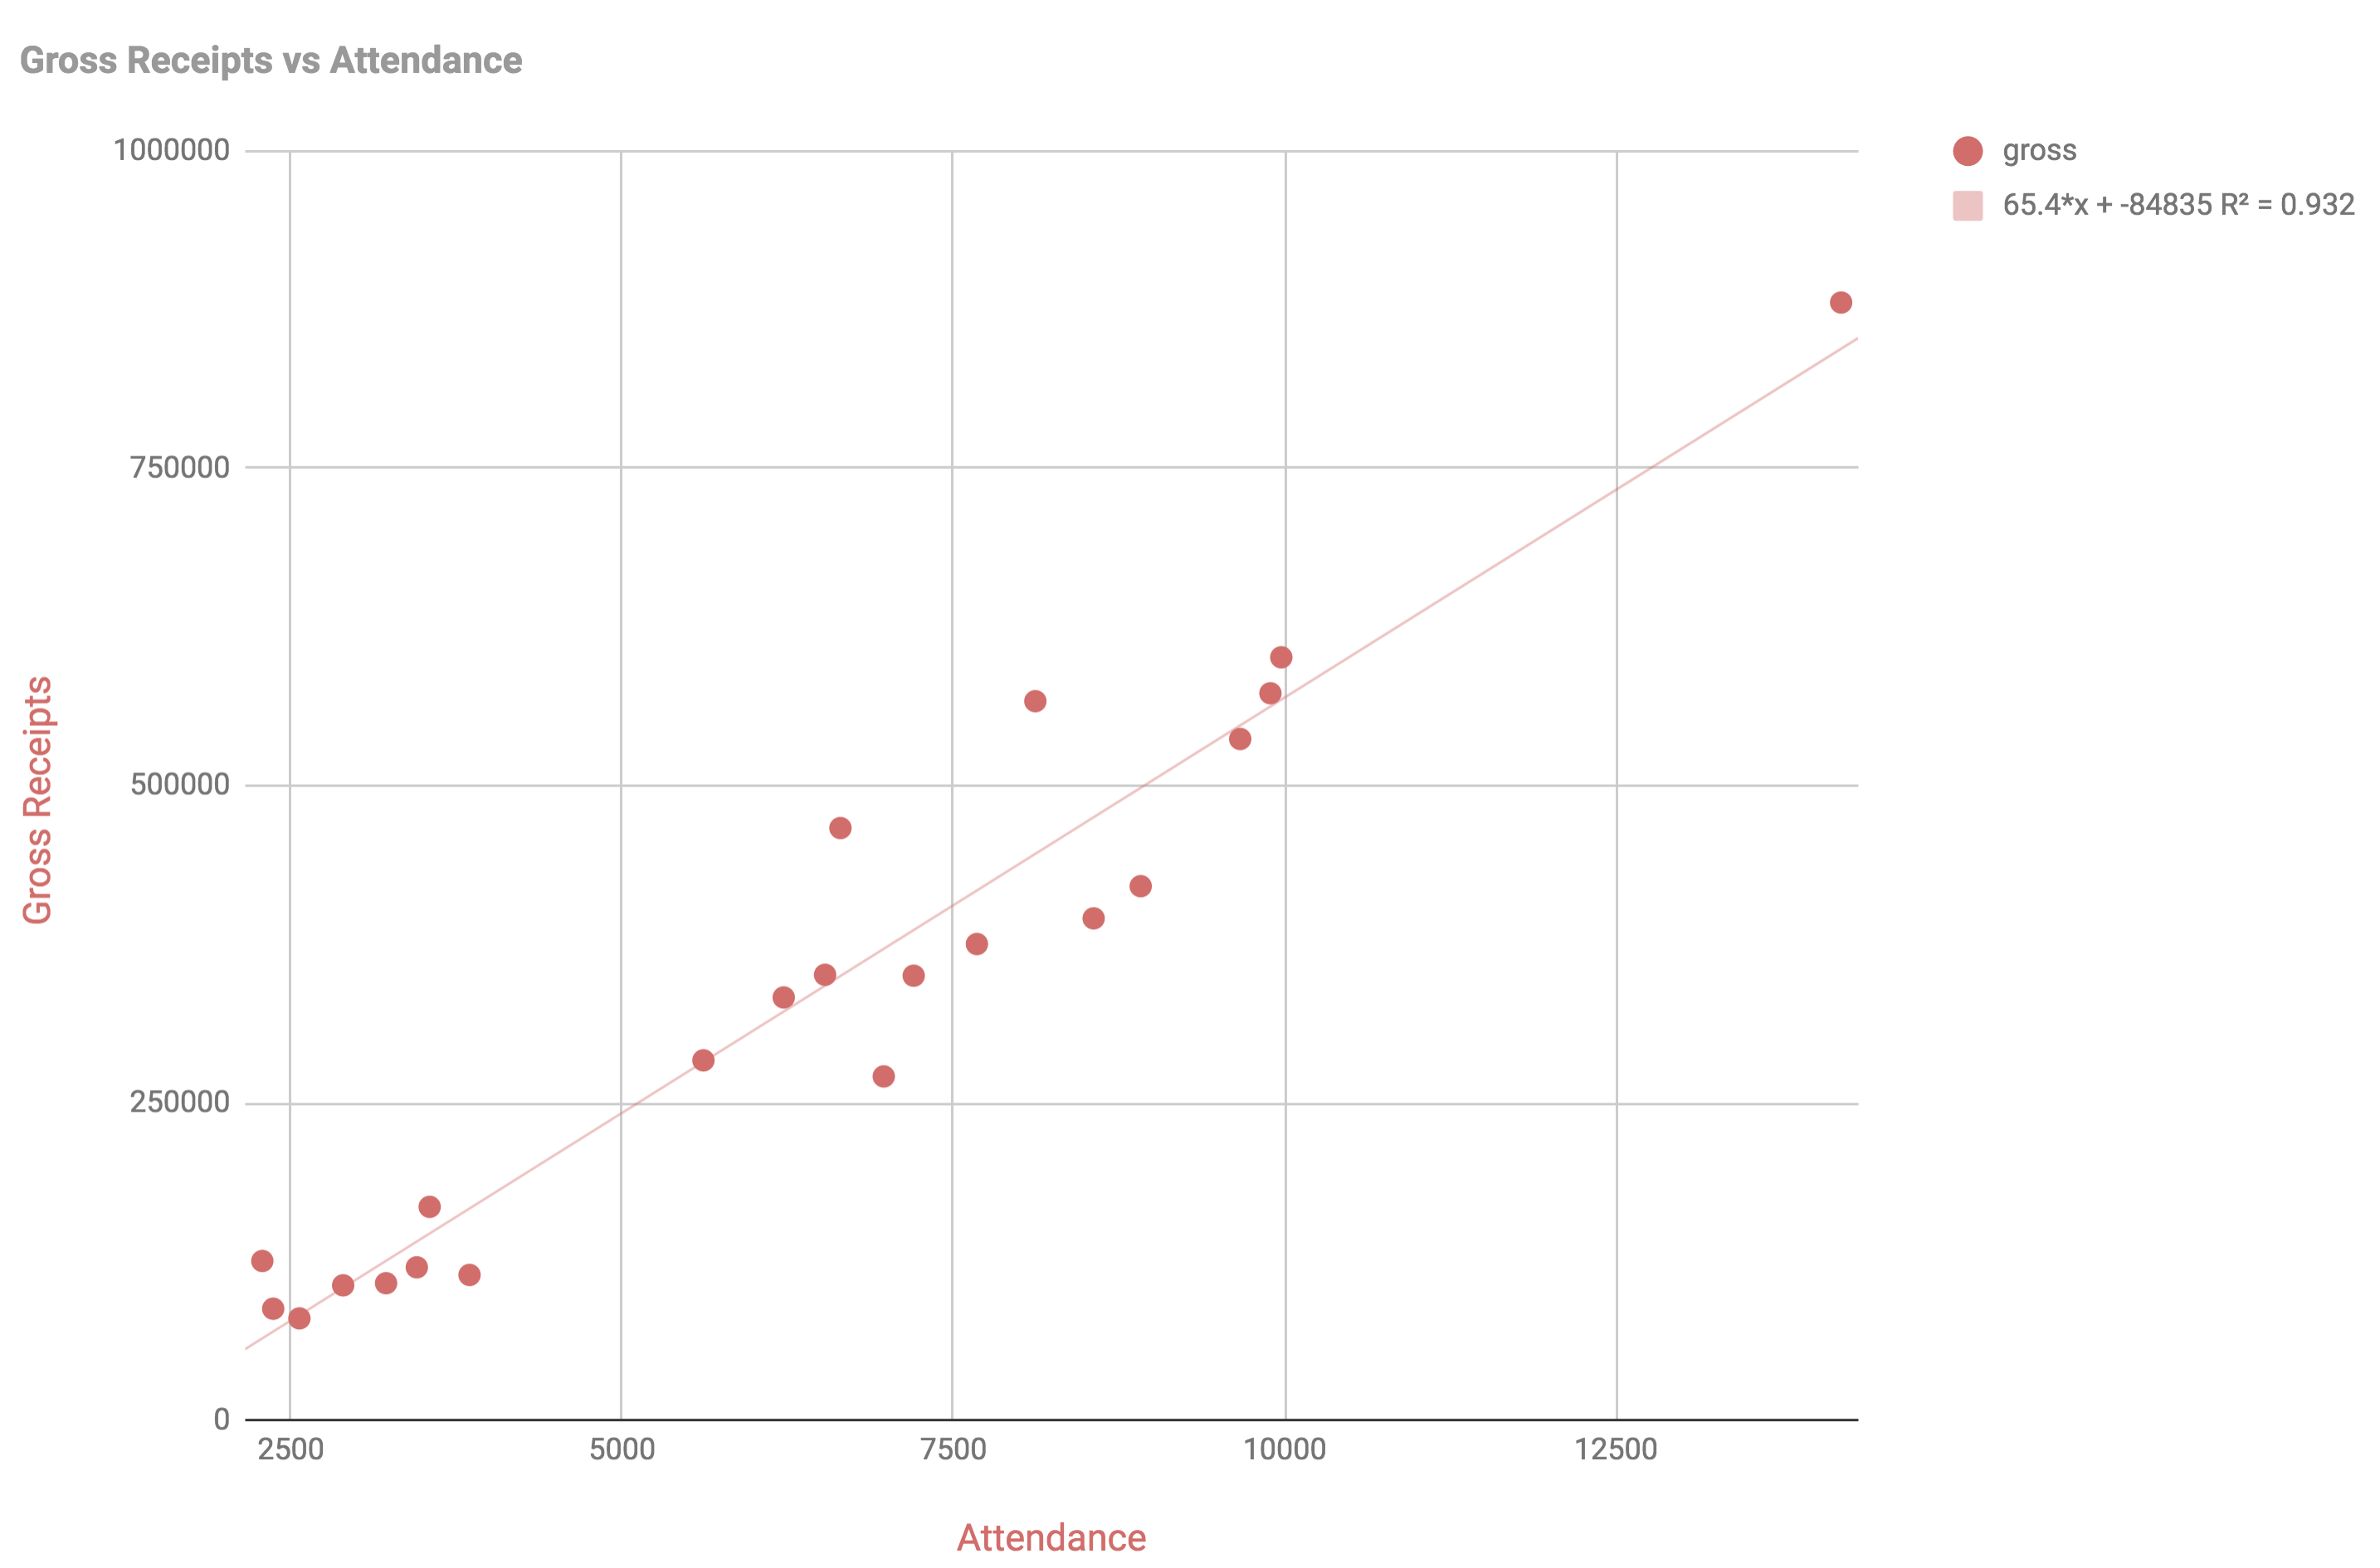
or it may look like this:
(There are other Course FAQ posts with Module 6 assignments! Please take advantage of them.)
So… I posted the answer to the least squares line here. If you did not get this then something is wrong with your work! (Maybe it is the order you used in the LINEST formula.)