
I’m having issues using the standard normal table backwards to look up the z value. For example, “If a left tail area = 0.2 how does z= -0.84 ?”
Step by step:
Let’s draw what we left tail area = .2 means.

Here is a picture of the area we want, showing approximately 20% on the left. We know that there is 50% from all the way to the left to 0 so where we see z = ? looks like .2
This helps us see that our z score is definitely going to be negative. I can also see that it won’t be z = -2 or z = -3 but closer to z = -1.
Using the normal table backwards we look up the z-value associated with the above given area:
You either use the chart in your book or the one I have on our site. It is under Learning Modules and then click on Standard Normal Table.
I am going to look for the value closest to 0.2 listed for the areas.
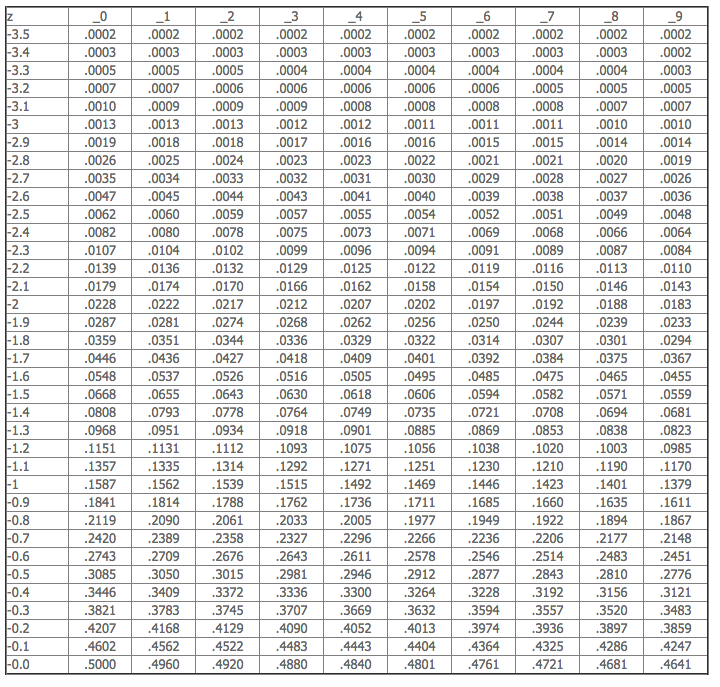
→ .2005 is the closest we have to .2 using this chart!
See the .2005 here enlarged.
![]()
So for the z-value we get:
z = -0.84
This is because you have .2005 is in the same row as -0.8 and then we match up with the column.
The column is ._4
So the z-value we want is -0.84.
Just to make sure you get the idea let’s look at all the areas before .2005. What would their z-scores be?
![]()
.2119 would be -.80
.2090 would be -.81
.2061 would be -.82
.2033 would be -.83